

In February 2025, the AIER Business Conditions Monthly indicators painted a picture of a moderately slowing but still resilient US economy. The Leading Indicator held at 54 for the second consecutive month, suggesting that forward-looking momentum is plateauing amid growing headwinds. The Roughly Coincident Indicator remained steady at 67, reflecting modest strength in current economic activity. However, the Lagging Indicator dipped to 75, down from 83 in January, pointing to slight softening in long-cycle components. The broad takeaway: while real-time and backward-looking indicators remain solid, early signals of deceleration warrant closer scrutiny.
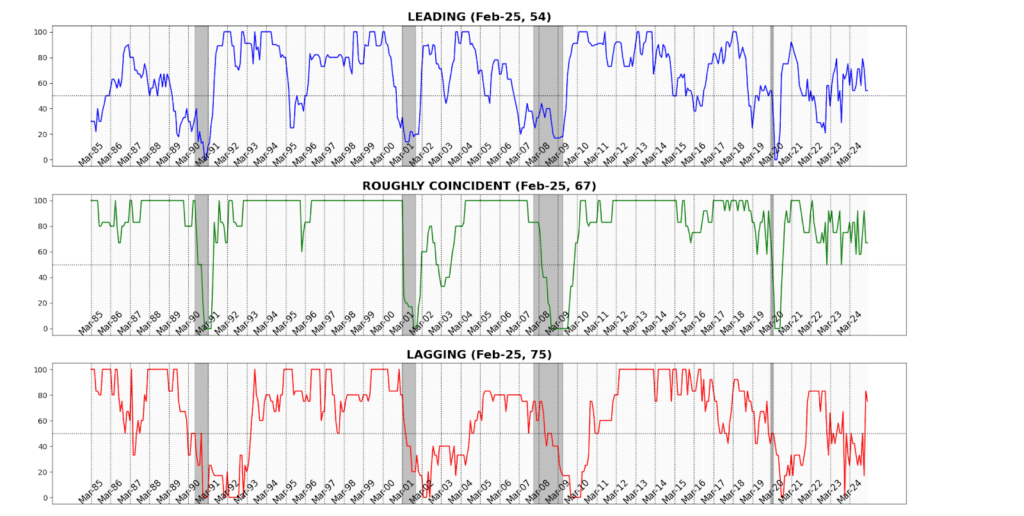
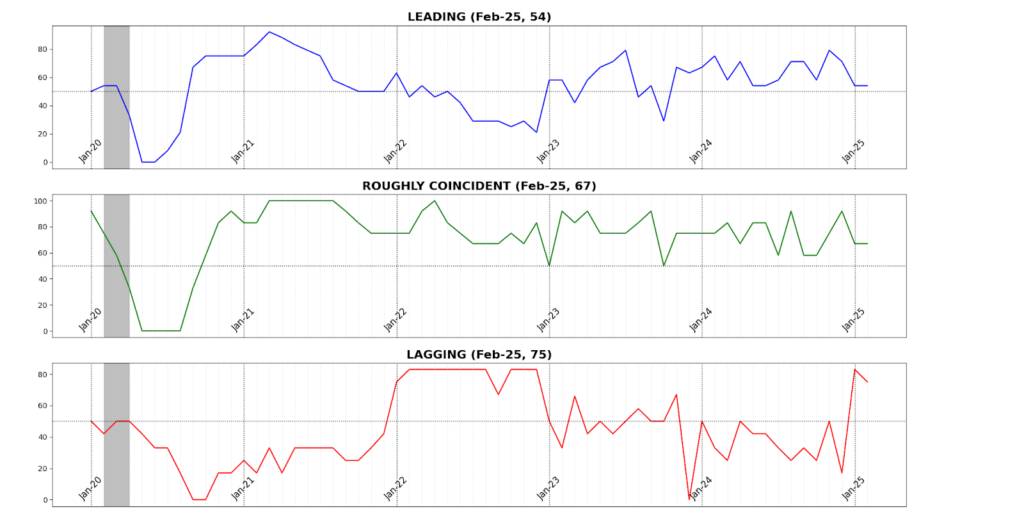
Leading Indicator (54)
Of the twelve Leading Indicator components, five rose, one was unchanged, and six declined in February.
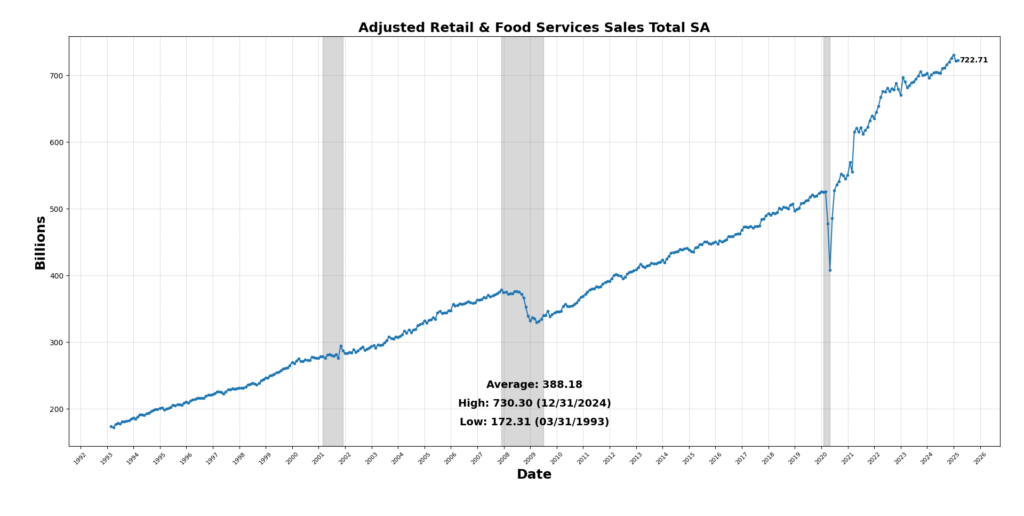
The strongest contributor was US New Privately Owned Housing Units Started by Structure Total SAAR, which rose 11.2 percent — likely reflecting preemptive activity in anticipation of higher construction costs from tariff effects. The Conference Board US Leading Index Stock Prices 500 Common Stocks advanced 1.0 percent, mirroring a resilient equity market, while Conference Board US Leading Index Manuf New Orders Consumer Goods & Materials increased by 0.1 percent, suggesting some momentum in near-term manufacturing demand. Adjusted Retail & Food Services Sales Total SA rose 0.2 percent, modestly rebounding after January’s softness.
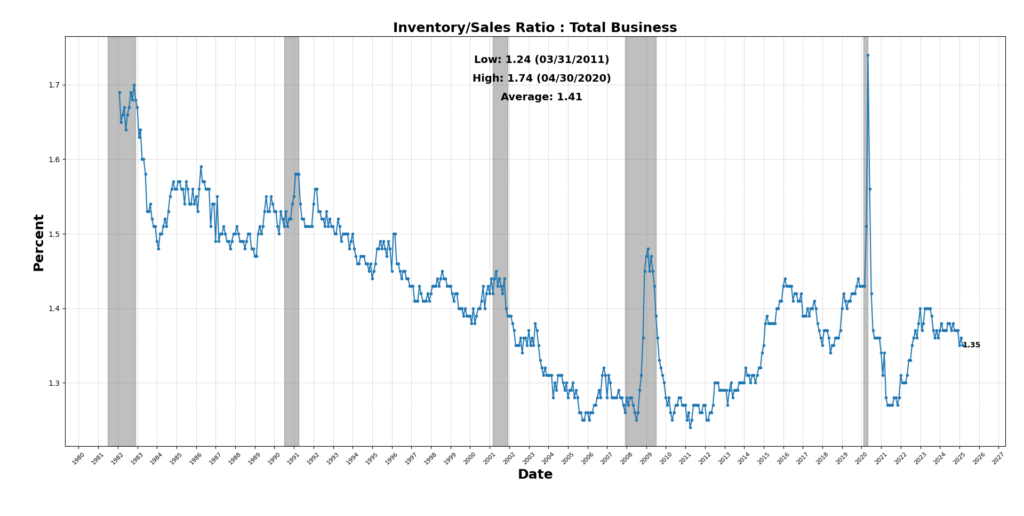
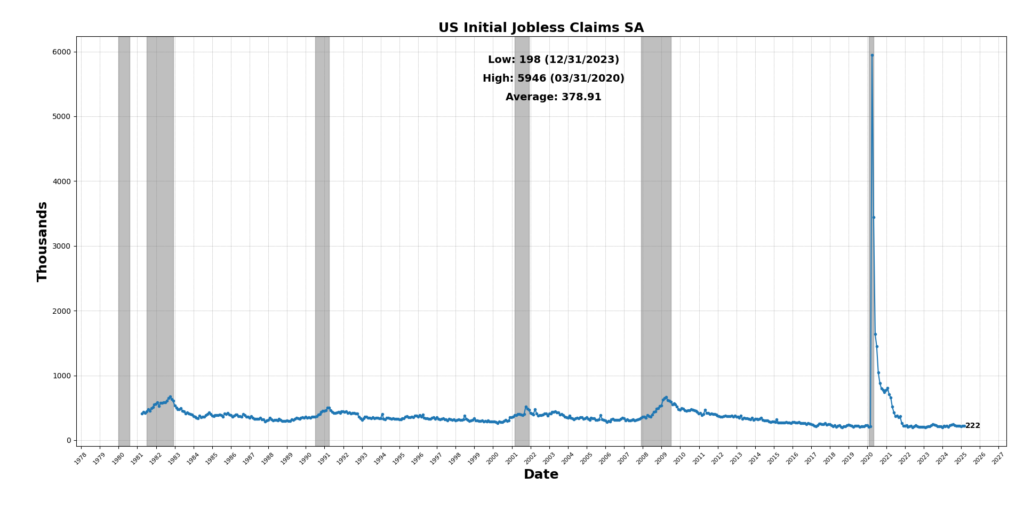
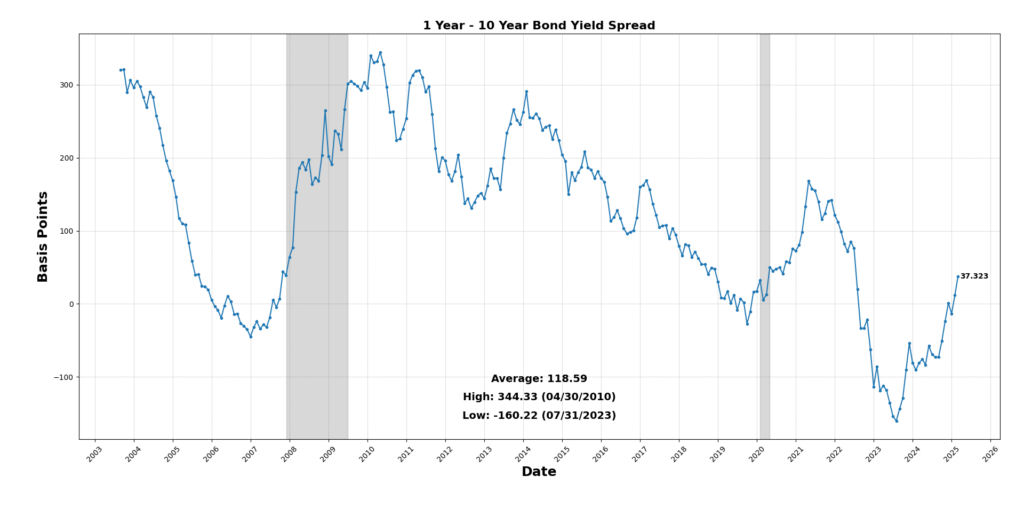
On the downside, United States Heavy Trucks Sales SAAR fell sharply by 11.4 percent, indicating weaker demand for large capital goods. FINRA Customer Debit Balances in Margin Accounts dropped 2.0 percent, pointing to declining investor leverage. Conference Board US Manufacturers New Orders Nondefense Capital Goods Ex Aircraft slipped 0.3 percent, a cautionary sign for business investment. Labor market signals weakened, as US Initial Jobless Claims SA fell 0.9 percent (a small positive), while the University of Michigan Consumer Expectations Index plunged 7.9 percent — signaling mounting consumer concern. The Inventory/Sales Ratio: Total Business was effectively flat at -0.01 percent. Finally, the 1-to-10 Year US Treasury Spread remained deeply inverted at 67.6 basis points, reinforcing long-standing recessionary signals.
Roughly Coincident Indicator (67)
Four of the six Roughly Coincident components rose in February, while two declined.
Conference Board Coincident Manufacturing and Trade Sales led gains with a 1.4 percent increase, supported by a 0.7 percent rise in US Industrial Production SA, which continued its upward trend across durable manufacturing sectors. The labor market saw slight improvement as US Employees on Nonfarm Payrolls Total SA ticked up 0.1 percent and Conference Board Coincident Personal Income Less Transfer Payments advanced 0.1 percent, suggesting slow but ongoing income growth.
Weakness was evident in the US Labor Force Participation Rate SA, which fell 0.3 percent — potentially reflecting early signs of labor market softening. The Conference Board Consumer Confidence Present Situation SA (1985=100) declined 1.3 percent, reinforcing consumer unease about current economic conditions despite solid activity.
Lagging Indicator (75)
Of the six Lagging Indicator components, five rose and one declined in February.
The most substantial gain came from the Conference Board US Lagging Avg Duration of Unemployment, which rose 3.2 percent, indicating that job seekers are spending more time out of work. Conference Board US Lagging Commercial and Industrial Loans rose 2.1 percent, suggesting stable business credit demand. The US Commercial Paper Placed Top 30 Day Yield increased 0.5 percent, signaling marginal tightening in short-term funding markets. Census Bureau US Private Constructions Spending Nonresidential NSA advanced 0.4 percent, while US Manufacturing & Trade Inventories Total SA remained virtually unchanged, rising only 0.002 percent.
The only decline came from US CPI Urban Consumers Less Food & Energy YoY NSA, which fell 6.1 percent, continuing the disinflationary trend in core inflation components and offering some breathing room for monetary policy.
February’s Business Conditions Monthly data suggest the economy is still growing, but under increasing pressure. Resilient coincident and lagging indicators underscore ongoing strength in current activity and long-cycle metrics, but leading indicators remain soft, with sharp drops in capital investment and consumer confidence. Elevated uncertainty around trade policy — especially as key tariff deadlines approach — is beginning to show up in forward-looking data. For now, the US economy remains on stable footing, but directional momentum is fading, and the risks of miscalibrated policy or global spillovers are rising. The outlook warrants cautious optimism — tempered by heightened vigilance.
DISCUSSION
March’s CPI report delivered a broad-based downside surprise, with both headline and core inflation coming in softer than expected and showing little to no evidence of pass-through from the 20-percentage-point tariff increase on Chinese imports. Key categories with high China import exposure — including apparel, furnishings, and recreational goods — saw either price declines or minimal gains, while core goods overall fell 0.1 percent after rising in February. Gasoline prices dropped 6.3 percent month-over-month, contributing roughly 19 basis points of drag to headline CPI, while deflation in discretionary services like airfares, car rentals, and hotels signaled a pullback in consumer spending. Although utilities prices rose 1.6 percent and food prices increased 0.4 percent — partly due to dairy — broader inflation pressure appears to be easing: the share of core categories with annualized inflation above 4 percent fell from 42 percent to 34 percent, and over 37 percent of categories are now experiencing outright deflation. Medical care goods also helped suppress inflation, with prescription drug prices falling 2.0 percent, and used vehicle prices reversed course with a 0.7 percent decline. The soft inflation print gives the Federal Reserve additional room to hold or ease policy, though rate cuts are still unlikely until late 2025 absent a credit shock. Meanwhile, the lack of price impact from tariffs may embolden President Trump to proceed with broader reciprocal trade measures after the 90-day pause announced April 9, with more definitive pricing effects likely to surface in the April CPI release due May 13.
Shifting back in the term structure, the latest PPI data show that producer price inflation is easing overall but remains sticky for goods, particularly those tied to exports. While March CPI data reflected outright declines in core goods prices, core goods in the PPI still rose, indicating a disconnect between input costs and consumer pricing. This suggests companies are increasingly absorbing higher costs rather than passing them on to consumers, signaling pressure on margins. A pricing environment where producer prices consistently outpace consumer prices typically precedes margin erosion. With earnings season underway, investor focus will turn to whether firms are beginning to feel this financial strain.
Data in February’s core PCE release gave a different picture of prices, rising at more than twice the pace needed to reach the Fed’s 2 percent target. That surge was driven in part by a 6-basis-point boost from rising health-care costs — particularly hospital services — linked to annual price resets. Durable and nondurable goods prices edged higher, potentially reflecting consumer stockpiling ahead of new tariffs, while prices for “other services” such as legal and household repairs also accelerated.
Outside of the major price indices, regional and sectoral surveys offer a more nuanced picture of pricing dynamics — and they’re sending mixed signals. Several indicators point to continued upward pressure on prices: the ISM Manufacturing Prices Index jumped to 69.4 in March, marking a strong acceleration. S&P Global’s US Manufacturing PMI showed output prices at a 25-month high, and both the New York and Richmond Fed surveys reported rising prices received in manufacturing and services alike. The Chicago PMI also indicated price growth, though at a slower pace, reinforcing the view that firms are still facing pricing power in many sectors.
However, other regions suggest softening inflation pressures. The Philadelphia Fed reported a decline in prices received across both manufacturing and services, with non-manufacturing prices even turning negative. The Kansas City and Dallas Fed surveys showed similar easing, particularly in services, where selling prices fell sharply. Meanwhile, the ISM Services Price Index, though still elevated at 60.9, decelerated from 62.6 the month prior. Overall, the data highlight persistent — but uneven — price momentum across the US, complicating the inflation outlook beyond the headline figures.
The ISM Manufacturing PMI fell to 49.0 in March, marking a return to contraction as Trump’s tariffs and industrial policy fueled uncertainty, with sharp drops in new orders (45.2), production (48.3), and employment (44.7), while input price pressures surged — driven by tariff-related metal cost spikes and supply chain disruptions — raising concerns over demand destruction, squeezed margins, and potential fallout in the upcoming jobs report.
Surveys have highlighted growing pessimism about US economic growth, fueling recent market volatility, but the hard data — especially labor market indicators — have not yet confirmed those fears. Bloomberg Economics forecasts a solid gain of 200,000 in March nonfarm payrolls, driven by a rebound in weather-sensitive sectors like construction and hospitality, the resumption of delayed state and local grant disbursements, and front-loaded hiring in trade and transportation ahead of new tariffs. Private payrolls are projected to rise by 168,000, with Homebase high-frequency data pointing to broad improvement across core job-creating sectors. However, federal hiring and professional/business services may be relative drags, and most tailwinds — like front-running of tariffs and delayed layoffs tied to the Department of Government Efficiency — are expected to fade in the second half of the year.
Although Homebase data suggest stronger March hiring, it also flags a sharp deceleration beginning in mid-March, likely to appear in April’s report due in May. That timeline aligns with expectations for DOGE-related federal layoffs to begin registering in payroll data, alongside a potential pullback in activity from earlier tariff front-running. Bloomberg’s model range of 170,000–230,000 sits above consensus, but underlying risks remain: February’s upside surprise was largely due to seasonal adjustments and one-off strength in manufacturing and waste services. With Chair Powell in no rush to cut rates and Trump seeking to maintain leverage through tariffs, March’s jobs report is unlikely to prompt a near-term policy shift — markets will need to wait longer for definitive evidence of slowing growth.
Consumer sentiment collapsed in early April, with the University of Michigan index dropping to 50.8 — its second-lowest reading on record — driven by soaring inflation expectations and anxiety over tariffs and economic policy. Expectations for the year ahead jumped to 6.7 percent, while long-run inflation expectations hit 4.4 percent, the highest since 1991. The decline was broad-based, with current conditions falling to 56.5 and future expectations plunging to 47.2. High-income households, previously more optimistic, reported the lowest expectations since 1980, aligning with lower-income respondents in a rare and worrying convergence. Consumers are increasingly pessimistic about the labor market, with the share expecting rising unemployment reaching the highest since 2009. Though recent inflation data surprised to the downside and job growth remains firm, nearly two-thirds of consumers spontaneously cited tariffs in survey interviews, underscoring how deeply trade policy is affecting sentiment. With political independents and Democrats registering the largest spikes in inflation fears, and the Fed signaling patience, expectations are now centered on a single 25-basis-point rate cut in December — absent a sharper deterioration in hard data.
Despite collapsing sentiment, signs of an actual pullback in consumer demand remain scattered. Mortgage applications surged over nine percent in early April, discretionary travel and dining activity were only modestly weaker year-over-year, and jobless claims remain low, with continuing claims falling to 1.85 million and the insured unemployment rate holding at 1.2 percent. However, employers remain cautious, and job openings have not materially rebounded since before the latest tariff announcements. Meanwhile, a sharp spike in trade-policy uncertainty has exceeded levels seen during Trump’s first-term US–China trade war, leading to widespread front-loading of imports and shipping congestion. Although tariffs have not yet fed through to higher prices, activity is being pulled forward in a way that likely sets the stage for a slowdown in the second half of 2025. With business investment plans weakening, labor market expectations deteriorating, and inflation expectations becoming unanchored, risks are mounting — even if the hard data have yet to crack.
Small-business sentiment declined sharply in March, with the NFIB optimism index falling 3.3 points to 97.4 — well below expectations — driven by worsening outlooks for sales and overall business conditions. Although most owners haven’t yet felt the direct impact of new US tariffs, policy uncertainty is already dampening hiring and expansion plans. The share of businesses raising prices dropped by the most since December 2022, while intentions to raise prices rose slightly, suggesting firms remain cautious about demand but concerned about cost pressures. Hiring plans also weakened, with only a net 12 percent of owners planning to create new jobs, even as labor retention remains a challenge. Despite a slight uptick, planned capital spending remains historically subdued, reflecting persistent uncertainty in both the domestic and global policy environment.
US retail sales surged 1.4 percent in March — marking the strongest monthly gain in over two years — driven largely by a sharp increase in auto purchases and robust demand for goods like electronics and sporting goods. The strength was broad-based, with 11 of 13 retail categories posting gains, though the standout was autos, which spiked ahead of President Trump’s impending 25 percent tariff on finished vehicles and parts. While the headline figures were broadly in line with expectations, upward revisions to February’s numbers and a 0.4 percent rise in the core “control group” suggest stronger-than-anticipated momentum heading into Q2. Much of that activity is attributable to tariff front-running, as consumers scramble to avoid imminent price hikes — particularly on Chinese-made goods now facing 145 percent levies. Retail data, which are not adjusted for inflation, may be distorted going forward, as future gains could reflect higher prices rather than real demand. Meanwhile, the deteriorating consumer sentiment discussed earlier and stock market losses are clouding the spending outlook, especially among lower-income households. Executives from companies like Ford, Walmart, and LVMH are bracing for margin compression and uncertain demand, while the Federal Reserve remains cautious, divided over whether tariff effects will be transient or inflationary. When the retail data was released financial markets were unmoved, likely recognizing that any perceived consumer strength may simply be consumption borrowed from future months.
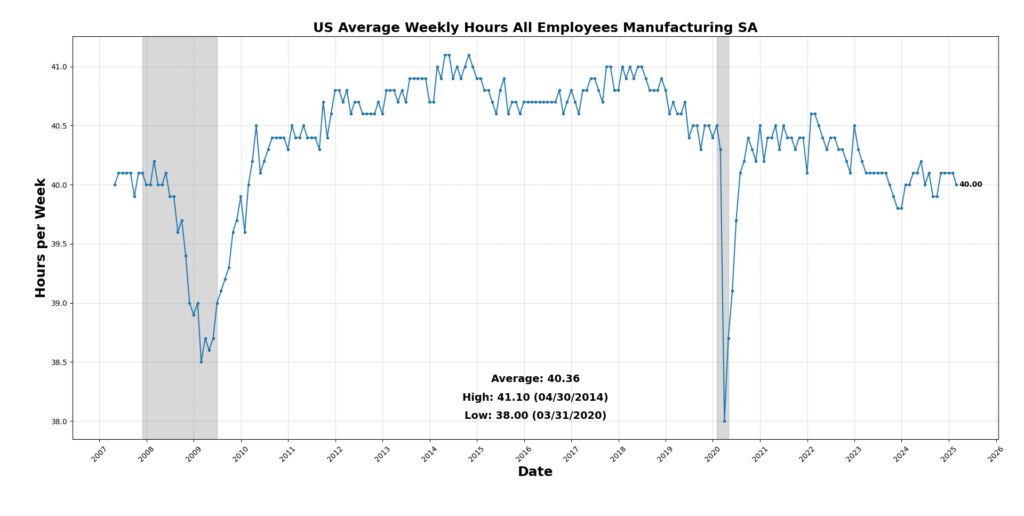
Industrial production fell 0.3 percent in March, largely due to a 5.8 percent drop in utilities output amid unseasonably warm weather, while manufacturing outperformed expectations with a 0.3 percent gain, driven primarily by vehicles and aerospace. Durable goods manufacturing rose 0.6 percent, while nondurables were flat, and aggregate manufacturing hours worked had hinted at this upside. Despite the headline weakness, mining activity rose 0.6 percent, and capacity utilization in manufacturing ticked up even as the overall rate dipped to 77.8 percent. However, the narrow breadth of factory gains and the likelihood of future supply chain disruptions from new tariffs suggest that manufacturing momentum may prove short-lived. The data reinforce that while March’s weather skewed utility output downward, the strength in industrial activity is concentrated and vulnerable.
Minutes from the March 18–19 FOMC meeting revealed that a majority of participants saw President Trump’s tariff policies as likely to generate more persistent inflation than previously expected — a view that aligns with the March Summary of Economic Projections, where nearly all participants saw inflation risks skewed to the upside for the first time since July 2022. Policymakers cited multiple sources of potential inflationary persistence, including tariffs on intermediate goods, the complexity of supply chain restructuring, retaliatory trade measures by other nations, and the fragility of long-term inflation expectations. While a few officials acknowledged difficulty in distinguishing between temporary and lasting price effects, others warned of potential trade-offs if inflation remains elevated while growth and employment weaken. Despite these risks, the committee maintained a wait-and-see stance, emphasizing reliance on hard data and expressing confidence in their readiness to respond as needed — though this stance increases the likelihood they will act too late if labor market conditions deteriorate. On balance sheet policy, most participants supported a gradual slowdown in quantitative tightening as consistent with 2022 guidance, though several questioned the need to do so now, and others noted that existing tools could manage any short-term reserve pressures linked to Treasury General Account volatility. Overall, Bloomberg Economics expects only one 25-basis-point rate cut in 2025, likely in December.
The US economy remains superficially stable, with March inflation readings softening and job growth holding up, but underlying risks are building. Consumer sentiment has plunged, business confidence is weakening, and inflation expectations — particularly among high-income households — are rising sharply amid growing tariff uncertainty. While headline CPI showed disinflation, producer prices remain sticky, suggesting firms are absorbing rising costs and facing margin pressure. Front-loaded hiring and spending ahead of new tariffs may temporarily buoy the data, but fading tailwinds and policy lags raise the risk of a downturn later in the year. With the Fed signaling just one rate cut in December and new tariffs advancing on critical sectors, the economy appears increasingly exposed to a policy mistake. With underlying risks mounting, strong caution remains the most prudent stance.
LEADING


ROUGHLY COINCIDENT


LAGGING


