AIER’s Business Conditions Monthly indicators for May 2025 point to tentative stabilization in the US economy, though underlying signals remain mixed. The Leading Indicator climbed 25 points to 63, reversing two months of declines and suggesting a modest improvement in forward-looking conditions. While still below its early-2024 highs, this rebound offers a potential early sign of firming momentum heading into the second half of the year. The stabilization may have been aided by the temporary suspension of the so-called reciprocal tariffs introduced on April 2, which had weighed on business sentiment and input costs.
The Roughly Coincident Indicator remained unchanged at 50 for the second consecutive month. This flat reading reflects a lack of clear direction in real-time economic measures, with neither widespread contraction nor convincing strength evident across the data. Meanwhile, the Lagging Indicator fell 33 points to 42, giving back all of April’s gains and reinforcing the notion that trailing metrics are beginning to match to the broader slowdown. As usual, such delayed movement in backward-looking data is consistent with late-cycle dynamics and underscores the need for caution despite the recent uptick in leading trends.

LEADING INDICATOR (63)
The Leading Indicator jumped sharply to 63 in May, driven by broad-based improvements across forward-looking indicators. Nine of the twelve components registered gains, marking a decisive shift from the contractionary readings seen in recent months.
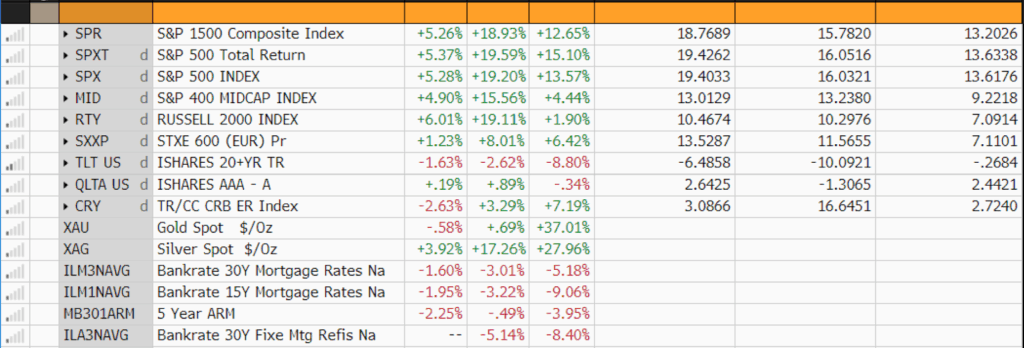
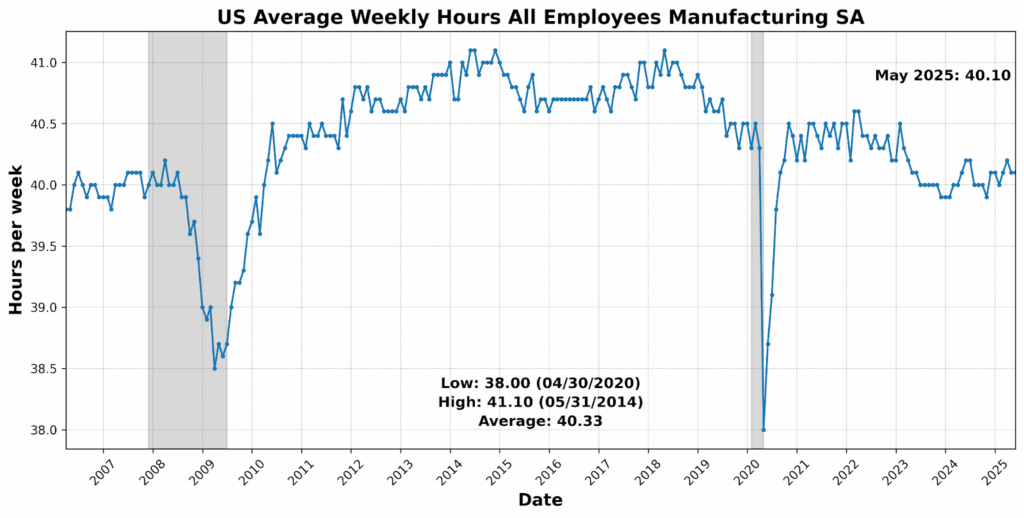
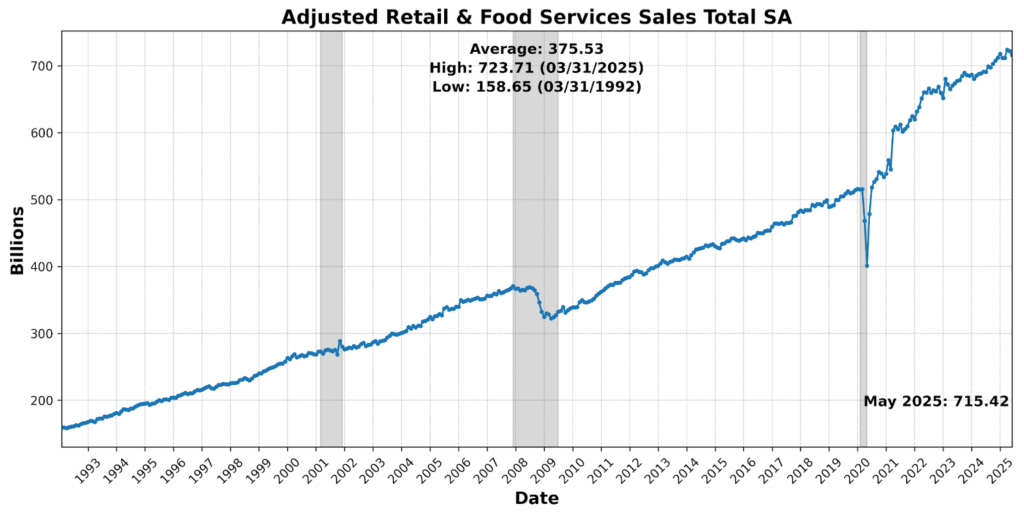
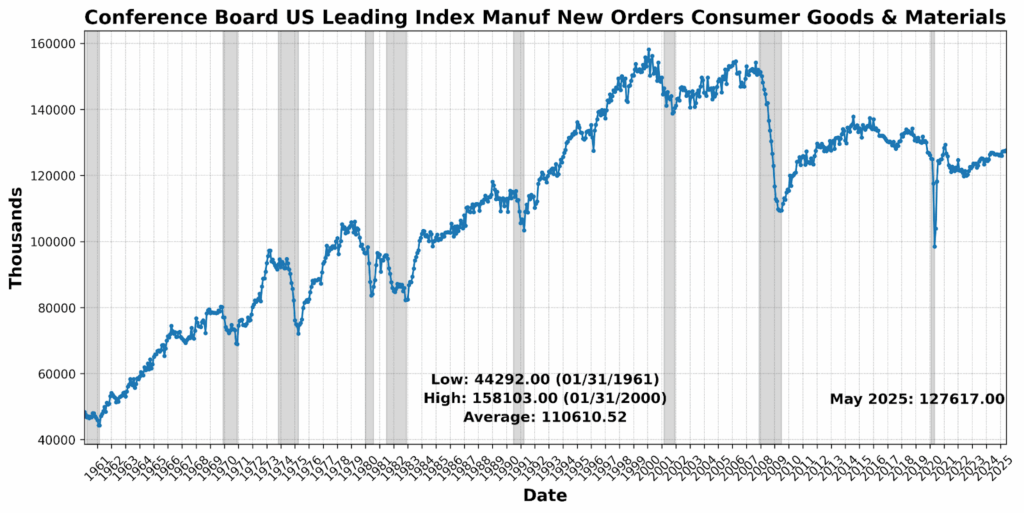
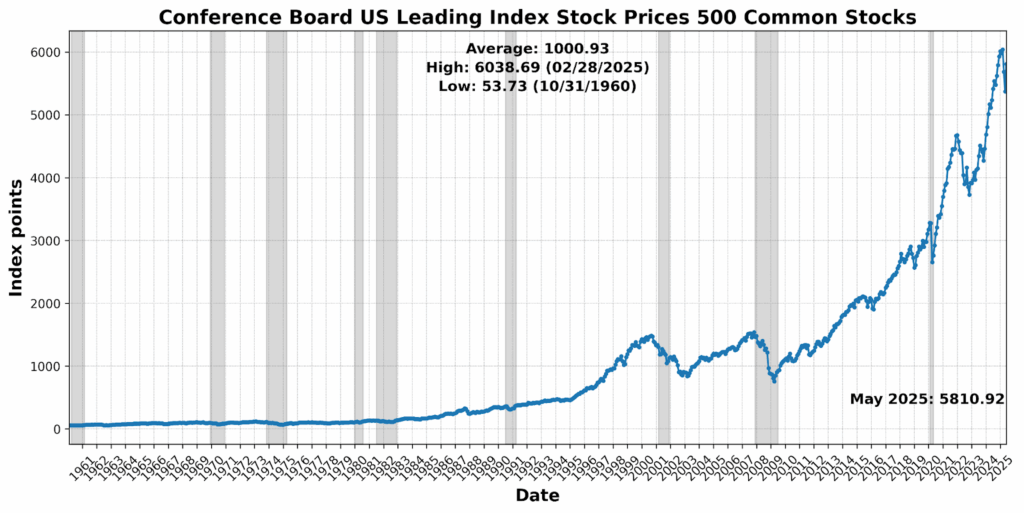
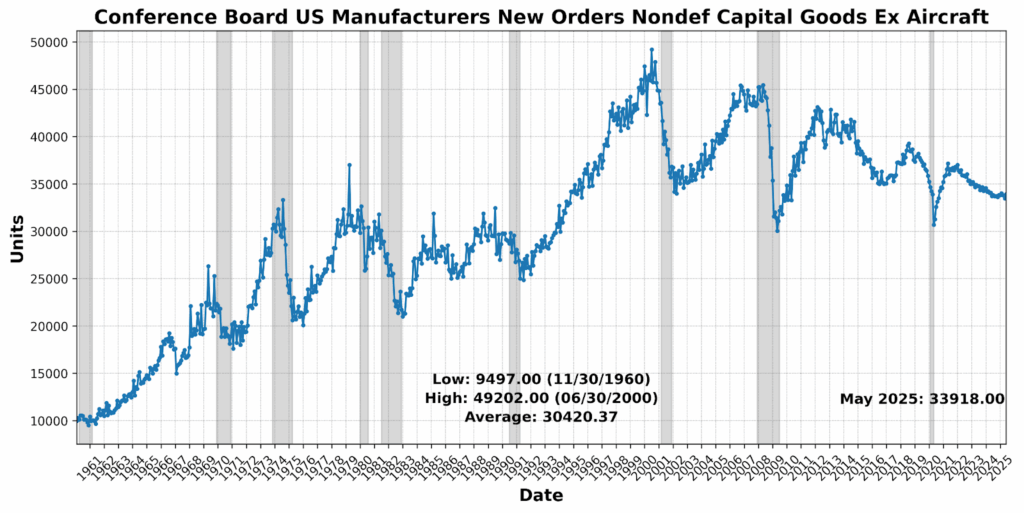
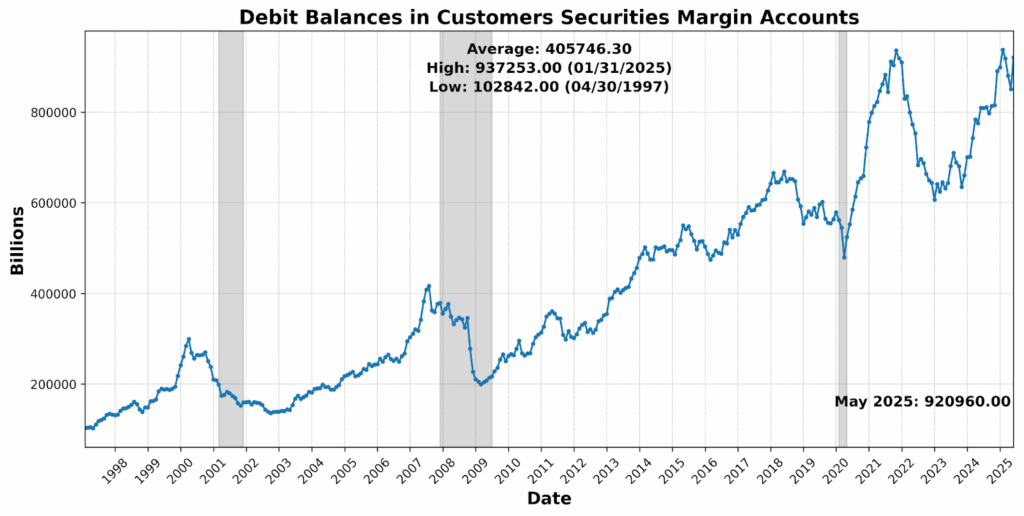
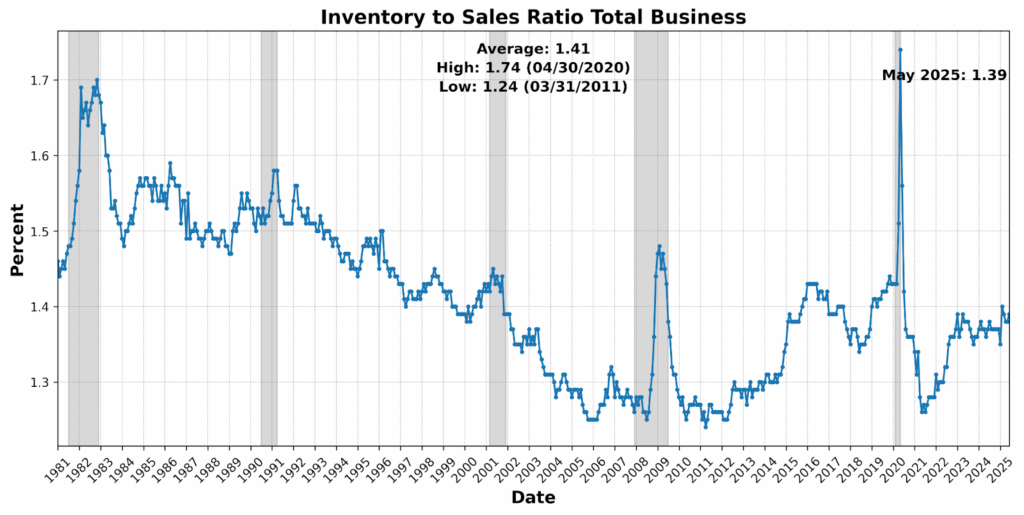
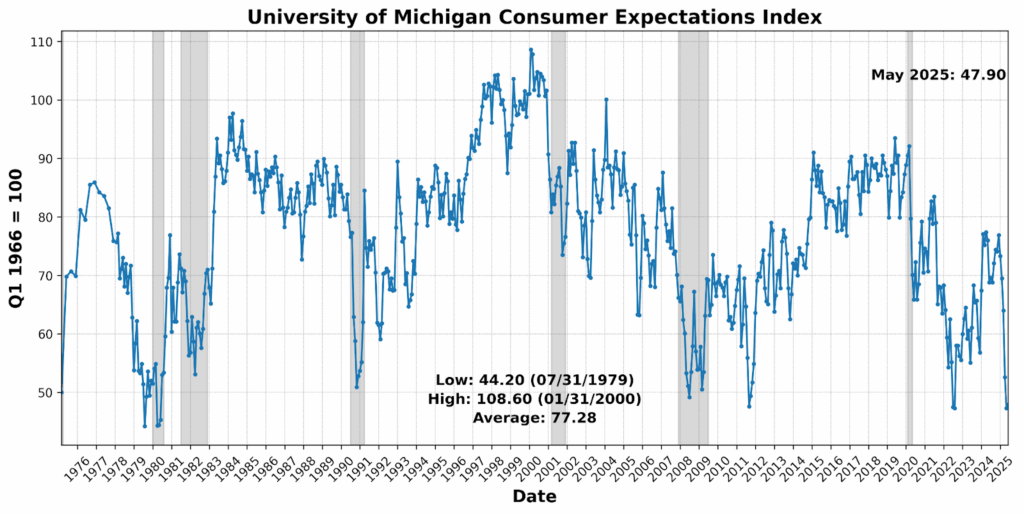
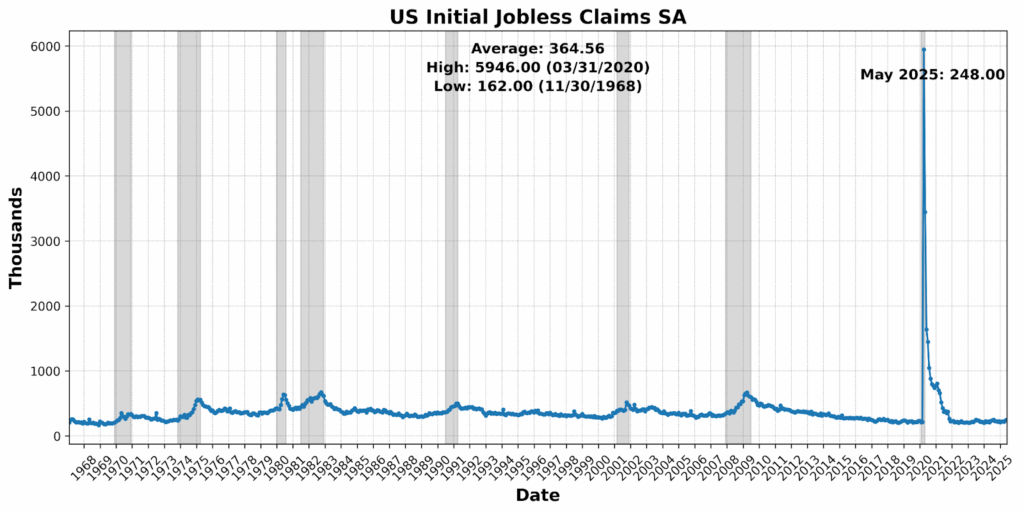
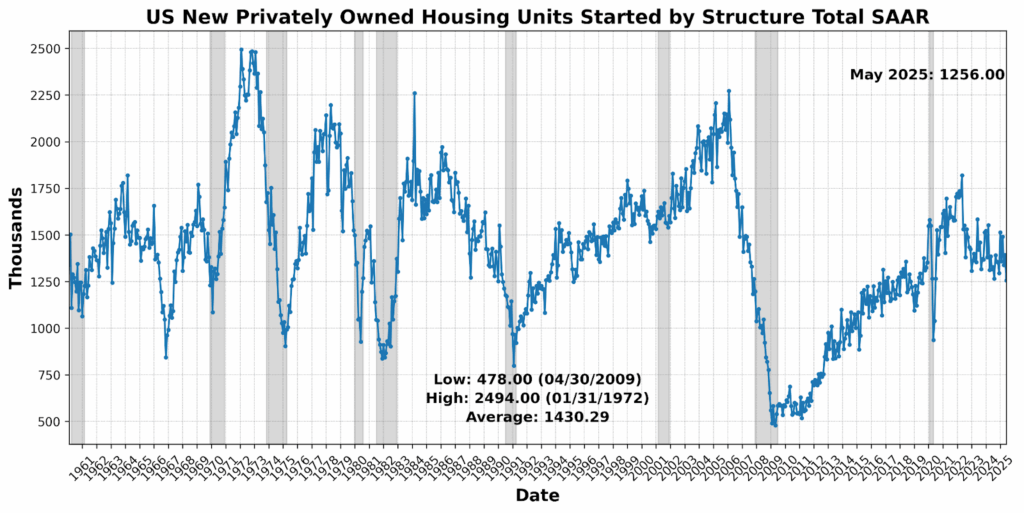
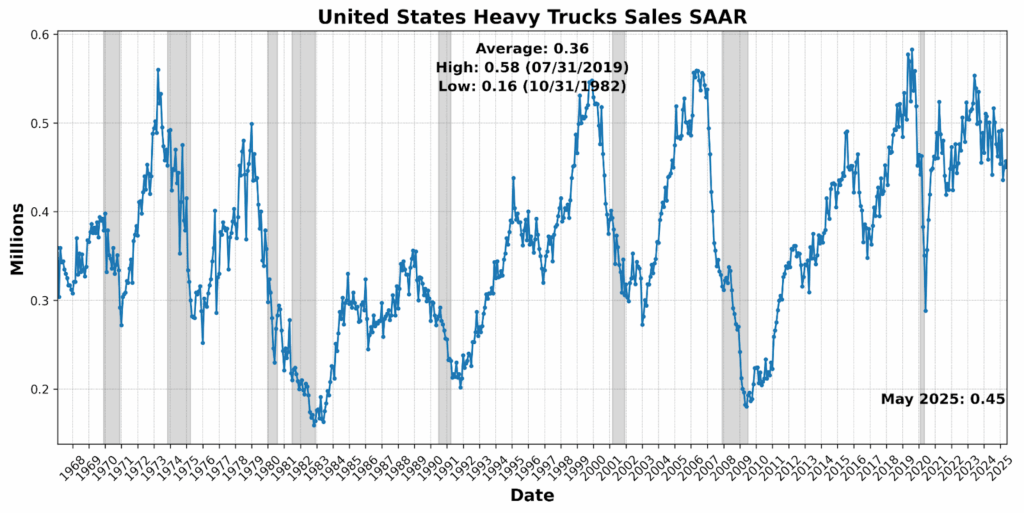
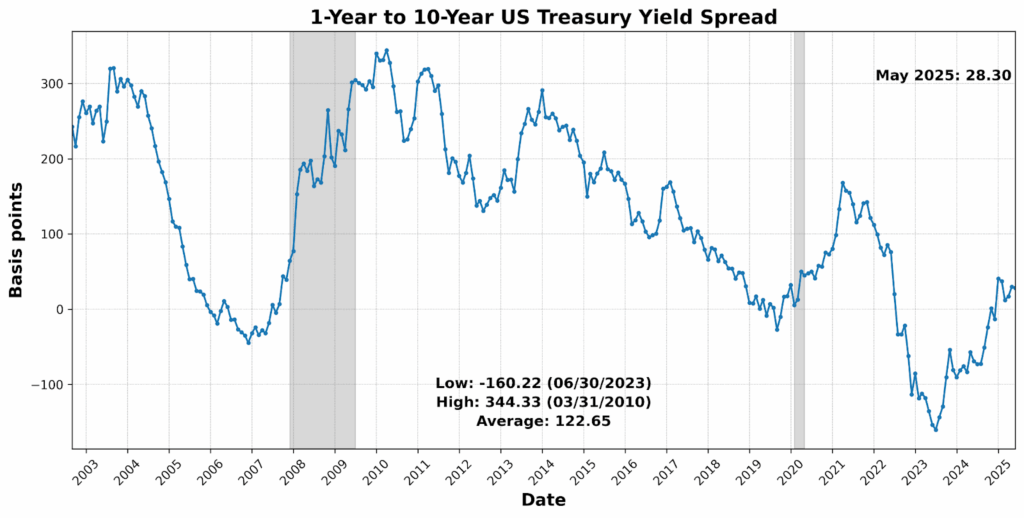
Stock prices led the way, with the Conference Board’s 500 Common Stocks Index climbing 8.2 percent, while debit balances in margin accounts surged 8.3 percent — both reflecting renewed investor risk appetite in the wake of the “Liberation Day” market crash. Initial jobless claims fell 2.9 percent, and the University of Michigan’s Consumer Expectations Index rose 1.3 percent, pointing to improved labor conditions and household sentiment. Manufacturers’ new orders for nondefense capital goods excluding aircraft grew by 1.4 percent, and new orders for consumer goods ticked up 0.2 percent. Average weekly hours in manufacturing were unchanged, signaling a pause in deterioration. Among the declining components of the index, new housing starts dropped 9.8 percent, retail sales declined 0.9 percent, and heavy truck sales fell 1.5 percent — indicating pockets of weakness in consumer and industrial demand. The inventory-to-sales ratio rose slightly by 0.7 percent, and the yield curve remained inverted, with the 1-year to 10-year Treasury spread narrowing further by 5.1 percent. Despite these headwinds, the improvement across most leading indicators suggests a potential turning point in forward economic momentum.
ROUGHLY COINCIDENT INDICATOR (50)
The Roughly Coincident Indicator held steady at 50 in May 2025, extending its streak of neutral readings and signaling an economy still searching for directional momentum. As in prior months, the underlying components remained mixed, with three indicators rising and three declining.
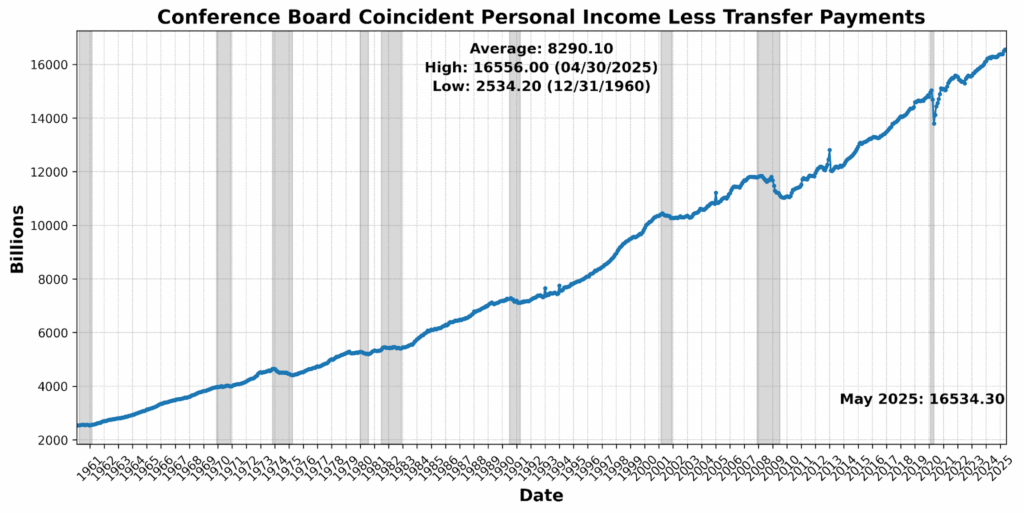
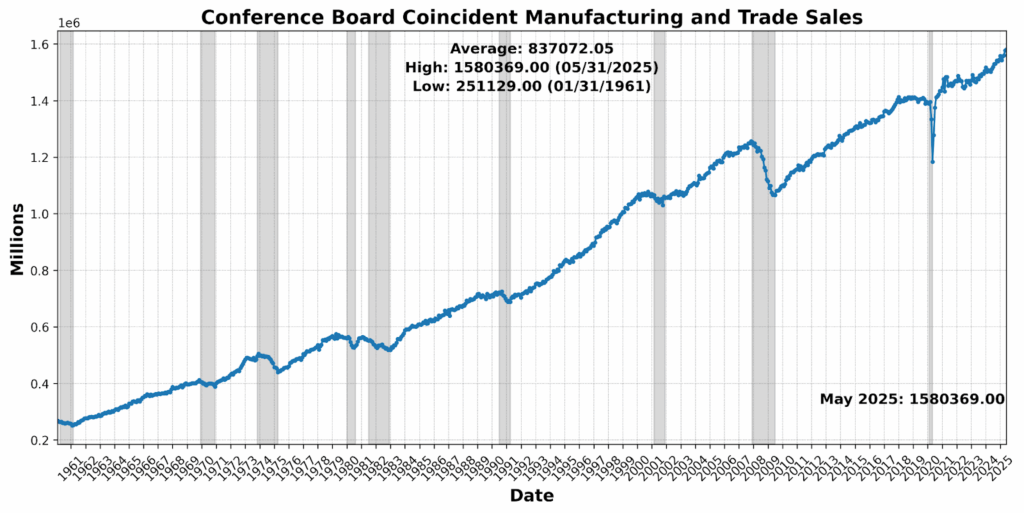
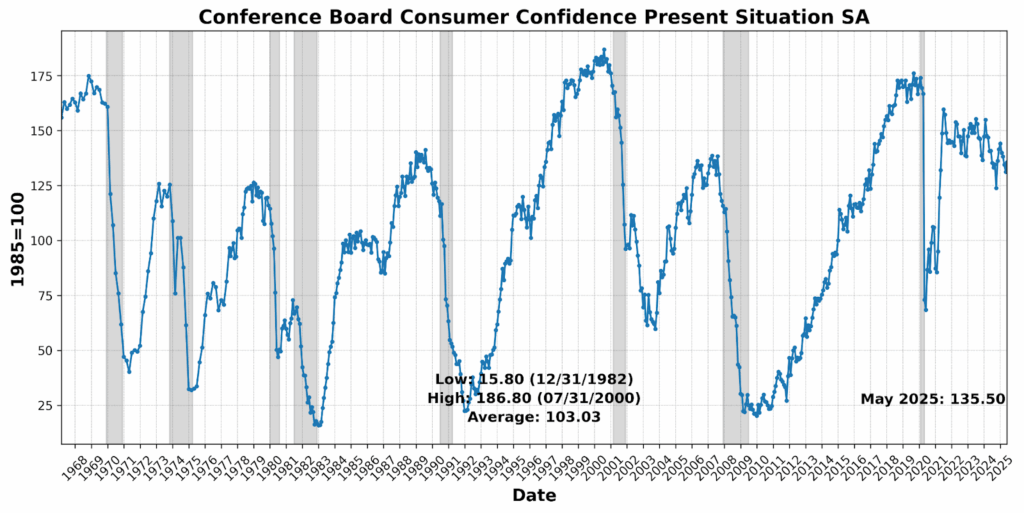
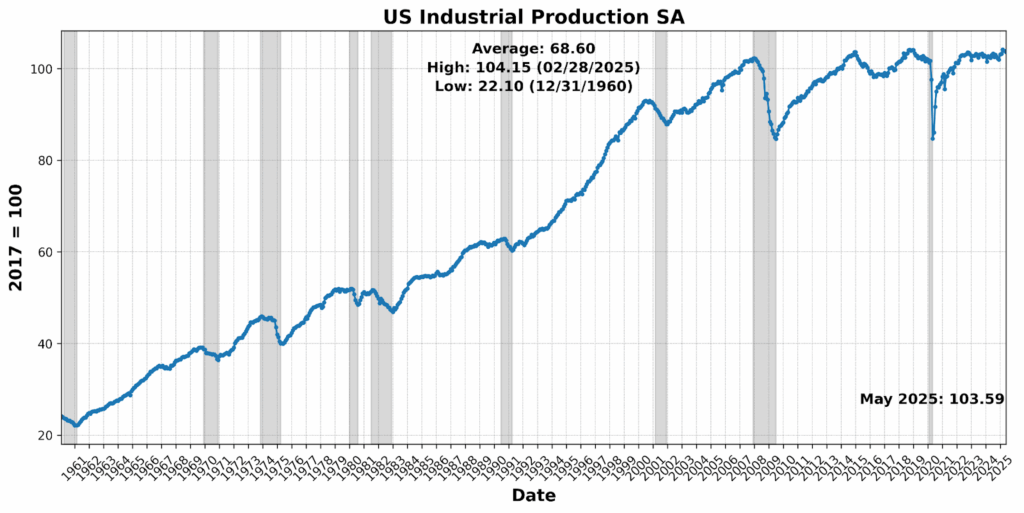
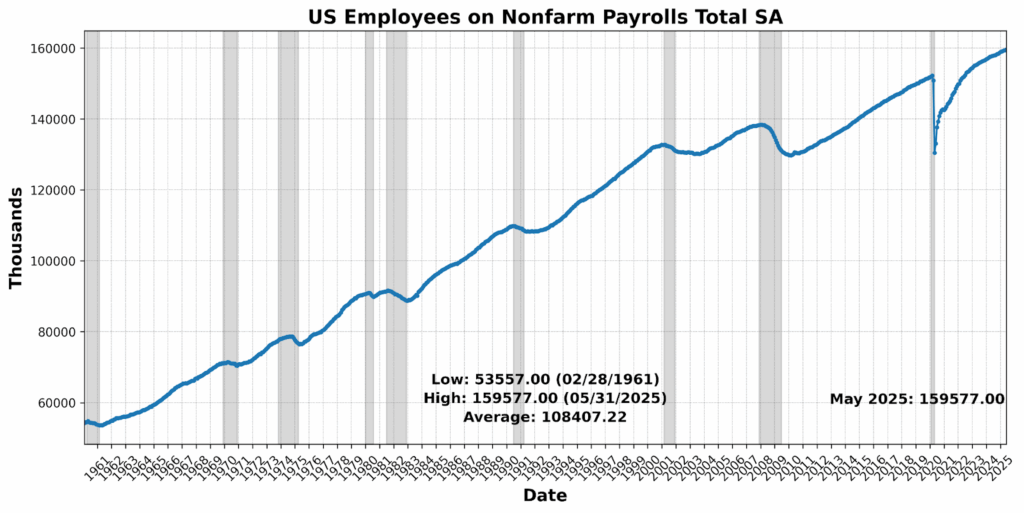
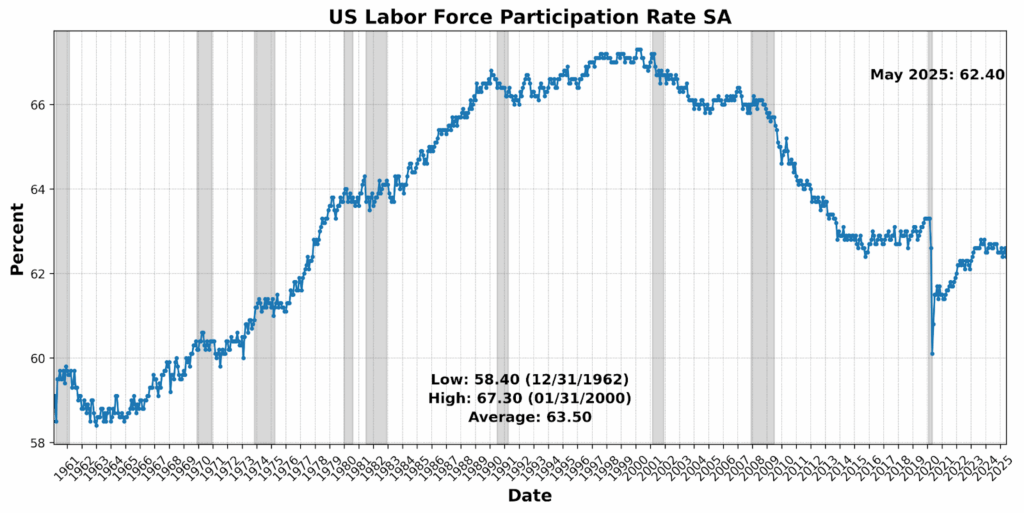
Conference Board Consumer Confidence Present Situation rose a strong 3.4 percent, suggesting households are feeling somewhat more secure about current conditions. Manufacturing and trade sales edged up 0.2 percent, and nonfarm payrolls posted a modest 0.1 percent gain — both hinting at continued, if modest, economic activity. Offsetting these improvements, personal income less transfer payments slipped 0.1 percent, while industrial production contracted by 0.2 percent. The labor force participation rate also moved lower, falling 0.3 percent, a sign that labor supply may be weakening slightly. Overall, the data continue to reflect a stalled expansion: one with enough strength to prevent decline but insufficient momentum to signal a sustained upswing.
LAGGING INDICATOR (42)
The Lagging Indicator fell to 42 in May, down sharply from 75 in April, as four of the six underlying indicators registered declines — marking a clear reversal from last month’s strength.
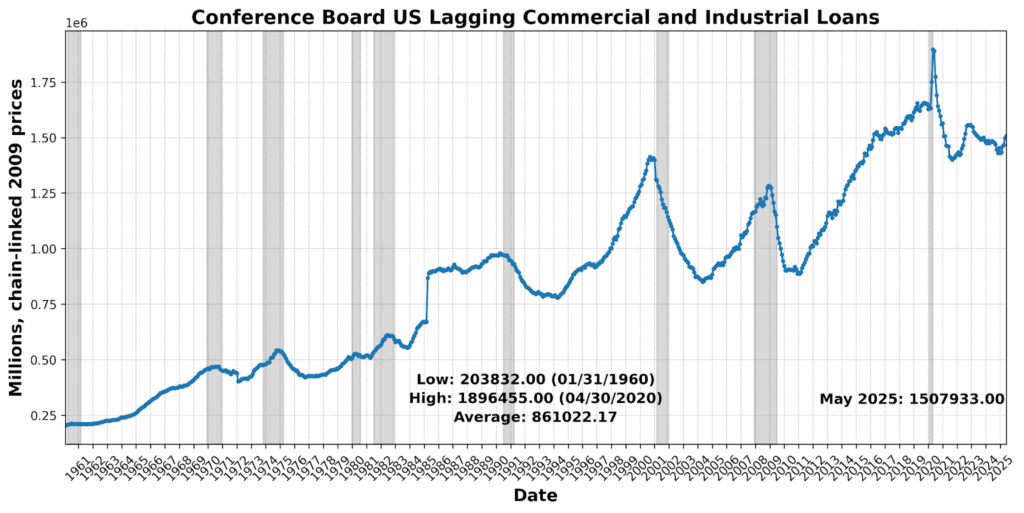
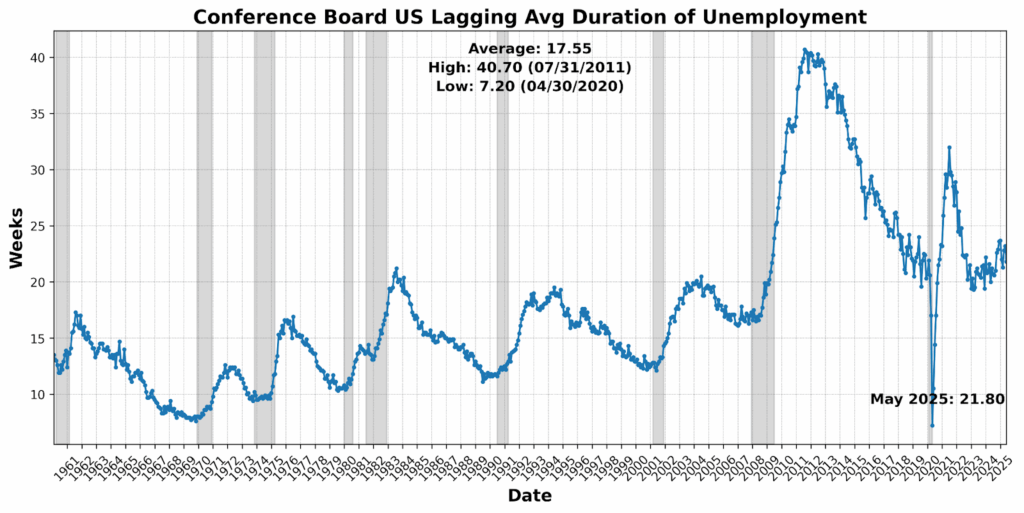
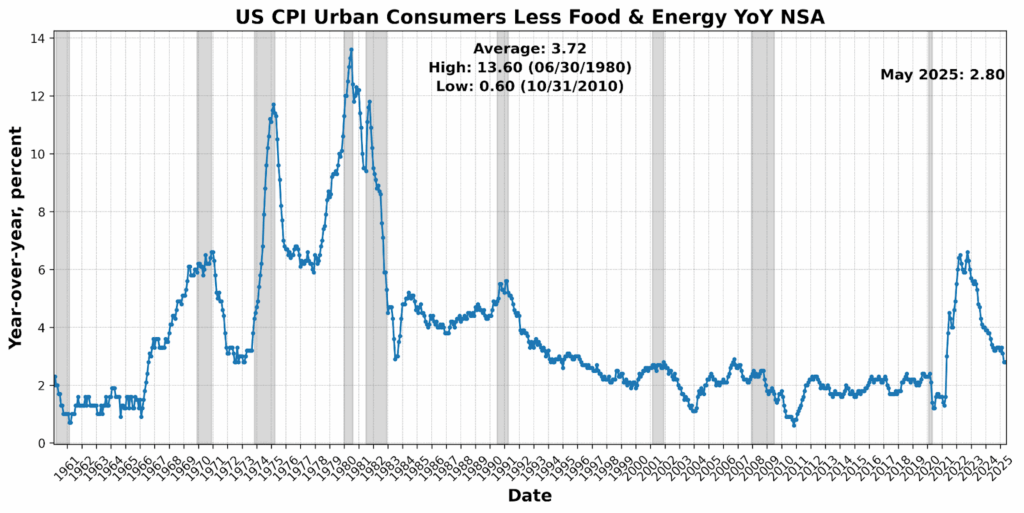
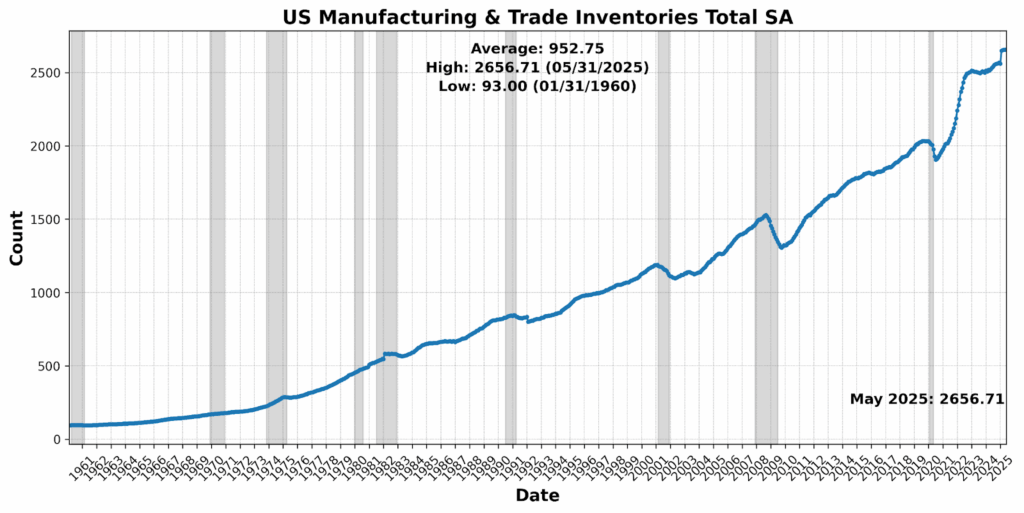
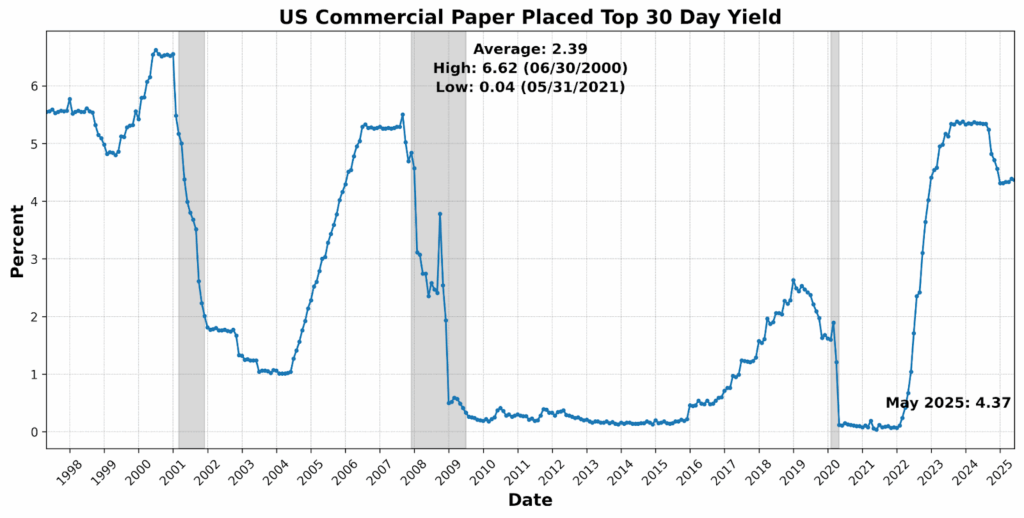
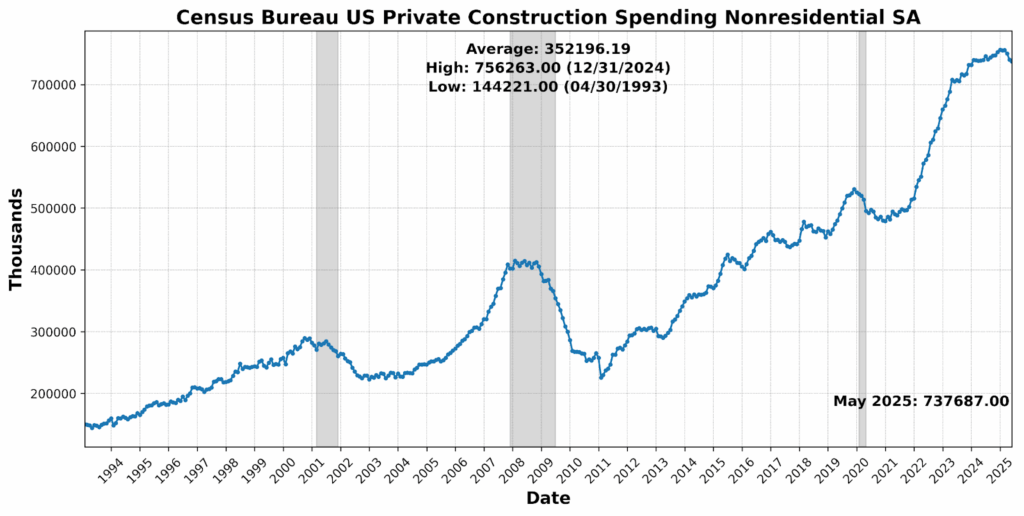
The most significant shift came from the average duration of unemployment, which dropped 6.0 percent — typically a positive sign, though sharp changes in this metric can also reflect volatility in labor force dynamics. Commercial paper yields declined 0.5 percent, and nonresidential private construction spending slipped 0.4 percent, indicating some tightening in credit conditions and a modest pullback in capital outlays. CPI excluding food and energy was flat year-over-year, offering no inflation surprise but also no added disinflationary momentum. Manufacturing and trade inventories remained unchanged, and commercial and industrial loans rose a modest 0.6 percent. On balance, the lagging data point to emerging soft spots in credit and investment, consistent with a maturing economic slowdown.
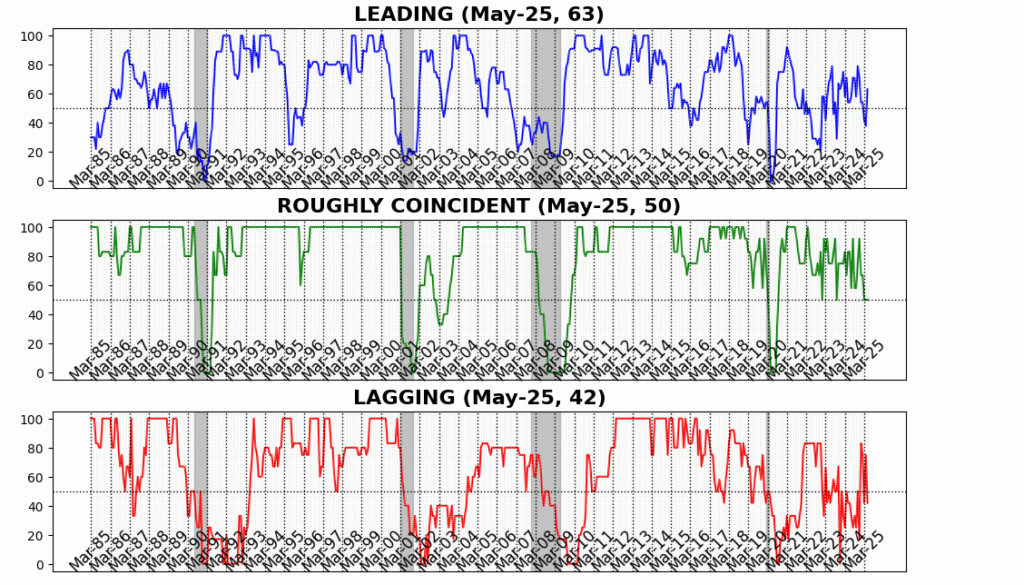
The recent trajectory of AIER’s Business Conditions indicators reveals a landscape marked by fragility, intermittent relief, and deepening divergences beneath the surface. After a brief surge in optimism in late 2024 — driven by November’s election results and the anticipation of business-friendly policy reversals — the Leading and Coincident Indicators both spiked. But the sharp collapse of the Lagging Indicator in December underscored that foundational pressures in credit, cost structures, and long-duration unemployment were already asserting themselves.
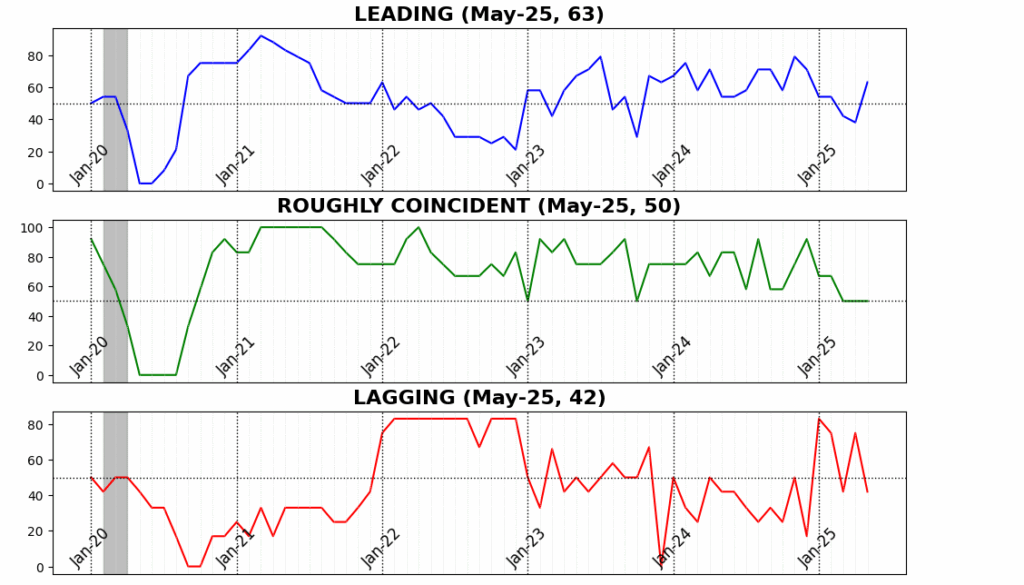
Following President Trump’s inauguration in January, the Leading Indicator began a steady slide, falling from 54 in both January and February to a low of 38 in April. That deterioration reflected rising anxiety around the administration’s aggressive trade and industrial policies, particularly the proposed implementation of immense tariffs beginning in early April. Coincident indicators flattened out at a neutral 50 in March and April, while the Lagging Index — more sensitive to trailing effects like credit usage and commercial construction — unexpectedly rebounded, suggesting the delayed momentum of late-cycle activity.
May, however, has brought a sharp counterpoint. The Leading Indicator jumping to 63 marks the strongest monthly gain since mid-2023, a rebound coinciding with the temporary suspension of the tariff platform on May 3. This offered a reprieve for investor sentiment and forward-looking components such as stock prices, jobless claims, and new orders. Yet that burst of optimism remains uneven: the Roughly Coincident Indicator held flat at 50 for the third straight month, suggesting current activity remains stagnant, while the Lagging Index slumped again to 42 — its third sharp swing in as many months.
Taken together, the data suggest the economy may be attempting to bottom out and reestablish momentum, but any recovery remains fragile and conditional. May’s leading improvement may prove temporary unless supported by firmer labor participation, industrial output, and consistent policy clarity. The last six months reflect an environment in flux — where volatility, rather than direction, remains the dominant economic feature.
DISCUSSION, June – July 2025
June’s inflation data painted a nuanced picture of crosscurrents in pricing pressures, with core CPI coming in soft but signaling the onset of more widespread tariff pass-through. While core CPI rose just 0.23 percent, annualized metrics nudged higher and diffusion indexes showed more categories experiencing price increases, especially among tariffed goods like appliances, sporting equipment, and furniture. Used and new vehicles, hotels, and discretionary services like air travel posted notable price declines, reflecting weakening demand as consumers grow more cautious amid softening labor markets and shakier income expectations. Services inflation was mixed, with medical prices rising and shelter costs remaining stable. Though headline CPI rose to 2.7 percent year-over-year largely due to base effects, tariff-related inflation contributed visibly for the first time, particularly in core goods categories. However, the broader inflation environment remains notably more subdued than during the pandemic-era spike, with many tariff-affected goods still priced well below year-ago levels thanks in part to China’s export deflation.
Producer price data for June 2025 reinforced this mixed narrative. Headline and core PPI were both flat in June, with services costs declining, driven by steep drops in accommodation and airline services. Goods inflation excluding food and energy rose 0.3 percent, reflecting restrained but growing pass-through from trade policy. Still, wholesale margins were stable, suggesting manufacturers and retailers are treading cautiously in raising prices, likely constrained by soft demand and high inventories. With June’s core PCE expected (July 26th) to come in at 0.3 to 0.34 percent — elevated, but not alarmingly so — markets are bracing for inflation to stay sticky through summer. For now, the Federal Reserve appears set to hold rates steady at its upcoming July (29th – 30th) meeting, citing uncertainty from fluctuating trade policy and inconsistent inflation signals. While President Trump is likely to increase pressure on the Fed to cut, officials appear inclined to wait until year-end — likely December — before delivering any easing, particularly given that current inflation metrics are not materially more dovish than when the Fed last cut in 2024.
Recent business activity data from ISM surveys showed signs of modest resilience in services and policy-driven noise in manufacturing, underscoring the economy’s sensitivity to shifting trade conditions. The ISM Services PMI edged back into expansion at 50.8, buoyed by a rebound in new orders and business activity as firms raced to front-run tariff implementation delays. However, customer hesitation and elevated input costs weighed on employment, which slipped back into contraction at 47.2, echoing broader hiring softness across the economy. The prices-paid index remained high at 67.5, underscoring persistent cost pressures in service industries, with several respondents reporting suppliers “testing” price increases amid tariff uncertainty. On the manufacturing side, the ISM headline index rose to 49.0 due to stronger production and inventory management, but the fundamentals — new orders, employment, and backlog — continued to weaken. Firms appear to be stockpiling inputs in reaction to evolving tariff policy rather than true demand growth. Employment fell further, while the prices-paid subindex accelerated to 69.7, pointing to rising input costs even as demand softens.
Regional data provided an early look into July and hinted at further inflationary tension building beneath the surface. The Philadelphia Fed’s manufacturing survey, which often leads national ISM trends, surged unexpectedly, with all major categories — new orders, shipments, and employment — snapping back into expansion. Most strikingly, forward-looking price expectations soared, with the index for prices paid over the next six months hitting 75.3, the highest since early 2022, indicating that firms widely expect inflationary pressure to intensify through year-end. A similar tone came from the Empire State survey, reinforcing the idea that July’s ISM Manufacturing PMI could push above the neutral 50 level. Together, these reports signal that even as headline inflation metrics remain contained for now, underlying price pressures are re-emerging, especially in goods. For the Fed, this complicates the picture: easing price momentum in services offers some relief, but tariff-fueled cost acceleration and renewed pricing pressure in manufacturing suggest a wait-and-see approach remains prudent. Policymakers are therefore likely to stay on hold in July, with a cautious eye toward wage softness, tariff pass-through, and the risk of reacceleration in the back half of 2025.
The May-to-June labor market narrative reflects a transition from surface-level resilience to underlying softening, particularly in private services. While June’s unemployment rate declined unexpectedly to 4.12 percent, this was driven by labor force exits, not a genuine strengthening in employment. Payroll growth beat expectations at 147,000, but that figure was inflated by the BLS’s birth-death model, which likely overstated business formation-driven job gains. Adjusted for that, underlying job growth may be closer to 70,000 per month. Private payrolls added only 74,000, weighed down by losses in professional and business services and sharp slowdowns in education and health sectors, the latter partly due to canceled federal contracts. Meanwhile, average hourly earnings rose just 0.2 percent and the average workweek fell to 34.2 hours, resulting in a near-zero gain in aggregate labor income. The U-2 unemployment rate (layoffs) ticked down slightly, but the duration of unemployment rose to 23 weeks, and continuing claims have steadily increased, suggesting it’s becoming harder for displaced workers to find new jobs. These dynamics imply a labor market no longer a source of strength for consumption and increasingly vulnerable to policy-driven shocks.
Incoming data through mid-July reinforced the message of a fragile labor backdrop. Initial jobless claims again fell unexpectedly, but this reflected seasonal noise tied to auto retooling, not a genuine improvement. Continuing claims — a better barometer of reemployment difficulty — continued their upward creep, consistent with rising average unemployment durations and stagnating weekly earnings. Job openings in May rose to 7.77 million, largely due to a surge in leisure and hospitality, likely in anticipation of Trump administration immigration policy shifts, while other sectors showed mixed hiring trends. Quits and layoffs remained stable, but hiring slowed in sectors like healthcare and manufacturing, and the vacancies-to-unemployed ratio ticked up to just 1.1 — well below its 2022 peak. The ISM’s manufacturing employment index fell again in June, consistent with regional Fed surveys showing weaker headcount and reduced hours. Together, these data point to a labor market that is loosening gradually beneath the surface, supporting the Fed’s patient stance. While headline payrolls remain positive, Fed officials are likely to focus on stagnant income growth, shrinking workweeks, and deteriorating reemployment prospects — factors that argue for caution rather than urgency in monetary policy adjustments.
Consumer sentiment improved modestly in early July, buoyed by rising stock prices and improved personal balance sheets, though the gains were uneven and politically polarized. The University of Michigan’s preliminary reading showed sentiment rising to 61.8 from 60.7, with respondents more optimistic about current and future conditions, particularly around vehicle and housing purchases. Inflation expectations also eased, with one-year and long-run projections falling to 4.4 percent and 3.6 percent, respectively — though Fed officials have emphasized more subdued market-based expectations. However, sentiment among Democrats slipped, likely in response to the Trump administration’s recent wave of tariff announcements and the passage of the One Big Beautiful Bill Act, widening the partisan gap in consumer views to a striking 37-point spread. In contrast, small-business sentiment continued to soften in June, with the National Federation of Independent Business (NFIB) optimism index slipping slightly to 98.6. Business owners cited poor sales, weak hiring plans, and a reluctance to invest in inventories: interestingly, despite relatively low concern over tariffs. Taxes remained their top reported problem, though that concern is likely to abate following the passage of the Trump administration’s “One Big Beautiful Bill.”. In sum, while consumers are cautiously more upbeat thanks to asset gains and easing inflation fears, small businesses are growing more defensive, signaling divergent sentiment paths and an overall environment of heightened economic uncertainty.
June’s retail sales rose a better-than-expected 0.6 percent, marking a broad-based rebound from May’s sharp 0.9 percent decline and reflecting strength in categories like motor vehicles, building materials, and general merchandise. However, the gain is difficult to interpret cleanly, as rising prices — particularly in tariff-impacted goods — likely inflated nominal sales, blurring the line between real demand and price pass-through. Electronics and furniture sales, which are among the categories most exposed to tariffs, fell modestly, reinforcing that price-sensitive discretionary demand is faltering even as nominal totals rise. The control group, used to estimate real consumption in GDP, rose 0.5 percent, though downward revisions to prior months suggest that second-quarter real consumer spending may undershoot current forecasts. Meanwhile, sales at bars and restaurants rebounded but remained below their three-month average, aligning with consumer sentiment surveys showing improved balance-sheet optimism but weaker income-related confidence, particularly among Democrats reacting to tariff news. The divergence between modestly stronger spending and weakening small-business sentiment — combined with evidence of slowing job growth and shorter workweeks — suggests the consumer is still spending but increasingly selective, and likely vulnerable to further price shocks. This dynamic is consistent with June’s CPI report, which showed mild core inflation overall but rising prices in tariff-sensitive categories, suggesting the apparent consumption resilience may prove short-lived.
The July 2025 Beige Book depicted a modestly improving economy, with overall activity characterized as having “increased slightly” — a meaningful upgrade from the prior report’s “slight decline.” Labor markets also showed mild improvement, though hiring remained cautious amid rigid policy uncertainty. While inflation was broadly stable, all 12 districts reported tariff-related input cost pressures, with many firms either raising prices or absorbing costs through compressed margins. Notably, the report highlighted expectations for elevated cost pressures through late summer, suggesting that tariff-driven inflation risks are mounting even before the latest rounds of duties take effect. Taken together, the Beige Book reinforces the Fed’s wait-and-see posture, as officials monitor whether rising input costs spill over into faster consumer price inflation in the months ahead.
Industrial production surprised to the upside in June, rising 0.3 percent on the back of a 2.8 percent surge in utilities output, which was powered by a 3.5 percent increase in electricity generation amid seasonal demand. Manufacturing output edged up 0.1 percent, reflecting weak momentum: production of durable goods was flat, and consumer durables declined due to a sharp 4.6 percent drop in motor vehicle output, which alone shaved 14 basis points off the headline. Notably, the largest utilization increases were in petroleum and coal products (up 2.4 points to 90.7 percent) and aerospace manufacturing (up 1.2 points to 74.8 percent), likely tied to summer energy consumption and ongoing defense or aviation activity. In contrast, electrical equipment (-2.1 points to 79.0 percent) and motor vehicles (-2 points to 69.3 percent) saw the steepest declines, consistent with tariff-induced price effects and softening demand in big-ticket goods. Total capacity utilization inched up to 77.6 percent from 77.5 percent, but underlying factory momentum remains mixed. The data suggest that while headline numbers are buoyed by non-manufacturing components, the core of the USindustrial base is still grappling with uneven demand, persistent trade policy uncertainty, and selective sectoral weakness.
In the US monetary policy hemisphere, Federal Reserve officials are increasingly divided over the path of interest rates, with most citing tariffs as a key inflation risk despite soft June CPI and PPI data. While a minority view tariffs as a one-time price shock, the majority believe they could drive more persistent inflation — especially as core PCE, the Fed’s preferred measure, is tracking at a hot 0.30 percent month over month and 2.75 percent year over year. Ten of 19 FOMC members now project at least two rate cuts by year-end, but seven foresee none at all, reflecting uncertainty over how tariffs will filter through prices and demand. Despite President Trump’s public pressure and growing criticism (which now includes politicized scrutiny of a $2.5 billion Fed building renovation, while the Fed sits on massive operating losses), policymakers maintained rates at 4.25–4.50 percent at the June meeting and signaled a cautious approach ahead. Some officials, like Governors Waller and Bowman, have opened the door to a cut as early as this month, but most favor waiting to assess the durability of tariff-driven inflation. Recent data suggest pass-through effects are intensifying in goods like furnishings, apparel, and recreational equipment, with further upside risks tied to the August 1 tariff hike. Labor markets remain stable but not accelerating, giving the Fed cover to remain on hold. Until clearer evidence emerges on how deeply tariffs are embedding into prices, the central bank appears poised to stay patient — with September shaping up as the next meeting for possible action.
And on the fiscal side, in a feat that at one point seemed doubtful, Trump’s “One Big Beautiful Bill” was signed into law on July 4, marking a sweeping fiscal package that combines permanent extensions of the 2017 tax cuts with deep spending cuts and a massive increase in defense and immigration funding. Though pitched as a pro-growth plan, the bill is projected to add between $3.4 trillion and $6 trillion to the federal deficit over the next decade, depending on accounting assumptions, pushing USdebt from 100 percent to as high as 130 percent of GDP by 2034. While the White House projects a GDP boost of up to 5.2 percent from the combined effects of tax cuts, deregulation, and tariff revenues, most independent analysts warn the bill’s fiscal imbalance will likely raise long-term borrowing costs, erode investor confidence, and potentially constrain monetary policy flexibility. The Federal Reserve, already facing internal division over the inflationary impact of tariffs and eyeing hot core PCE inflation prints, now must navigate a landscape in which fiscal expansion could counteract disinflationary pressures and delay rate cuts. With June’s inflation data showing tariff pass-through and upward momentum in core services, the Fed remains in wait-and-see mode — complicating Trump’s calls for immediate rate relief. In the short term, economic growth may benefit from stimulus effects, but elevated deficits, policy uncertainty, and rate rigidity pose serious medium-term risks. Ultimately, the bill has intensified the clash between expansive fiscal policy and cautious monetary stewardship, heightening the stakes for both inflation management and future financial stability.
Last month we characterized the growth path as a balancing act on a narrow ledge. Although passage of the One Big Beautiful Bill removes some uncertainty, the recent jawboning about higher average US tariffs on global imports, extra duties on BRICS nation imports for continuing to explore dedollarization, and a 50 percent tariff on imported copper — despite the US being a decade or more away from resource independence — bring us to the same conclusion. While growth may receive a near-term lift from the bill’s stimulus effects and a modest uptick in consumer sentiment, the combination of mounting trade friction, rising input costs, and a gradually weakening labor market suggests that any expansion will be uneven and fragile. Inflation pressures remain a central concern, with tariff pass-through increasingly visible in goods categories and forward-looking manufacturing surveys pointing to renewed cost acceleration. The Federal Reserve, navigating internal division and politically charged scrutiny, is likely to maintain a cautious stance through summer, awaiting clearer evidence of either embedded inflation or labor market deterioration. Meanwhile, equity markets near all-time highs reflect optimism that may prove overstretched if inflation re-asserts or monetary easing is delayed. The resulting divergence between buoyant asset prices and tepid-to-deteriorating real-economy indicators underscores how precarious current conditions are. Barring a major positive shock, the second half of 2025 is likely to remain marked by policy-driven crosscurrents, narrow growth margins, and elevated downside risks.
LEADING INDICATORS
ROUGHLY COINCIDENT INDICATORS
LAGGING INDICATORS
CAPITAL MARKET PERFORMANCE